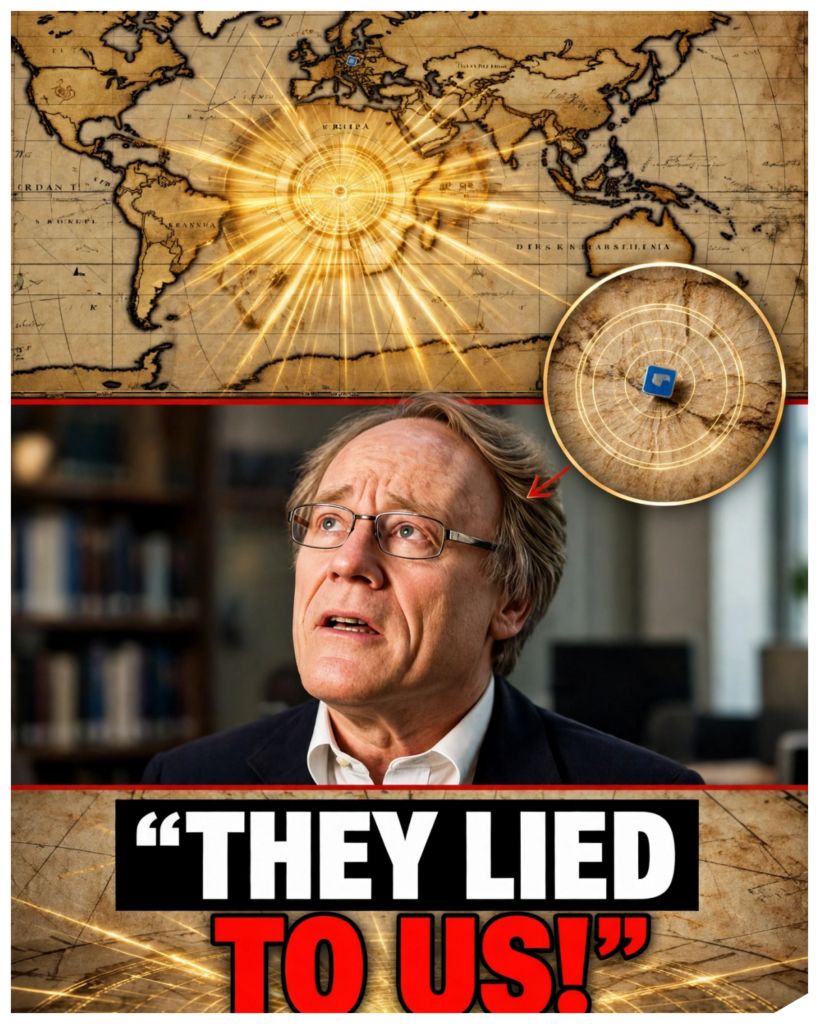
We’re talking about maps that were drawn roughly between the 1300s and the 1700s.
However, these maps were largely based on much older source maps which they copied.
And we can say that for sure because one of the famous maps is the Pir map.
What if a 500-year-old map showed coastlines so precisely that you’d swear someone surveyed them from the air?
That is the question at the center of one of the most famous alternative history theories of our time.
The author Graeme Hancock argues that certain old charts, the piri race map above all, preserve knowledge from a lost civilization that mapped the world at the end of the last ice age before a global catastrophe wiped it away.
A civilization with technology, he suggests that rivals our own.
It is a breathtaking idea.
It turns a faded scrap of gazelle skin into a message from 12,000 years ago.
And it has won Hancock millions of readers, a Netflix series, and one of the most watched archaeology debates in history.
But maps are things you can check.
They have dates, authors, sources, and measurable errors.
They can be laid beside satellite images, ice cores, and radar surveys.
And when you do that, the story changes.
So tonight, we’ll follow the claim the way Hancock tells it.
We’ll meet the man, the map, and the admiral who drew it.
We’ll look at what the map really shows, what its maker said about his sources, and what Antarctica actually looked like 12,000 years ago.
Some of what we find will undercut the theory, some of it will make the real history more remarkable than the legend.
And one part of Hancock’s argument turns out to be a genuinely good question.
Let’s start with the man who dared to ask it.
The man who asked Graham Hancock was born in Edinburgh in 1950.
He studied sociology at Durham University, then worked as a journalist, including a stint as East Africa correspondent for The Economist before turning to books.
His first big hit in 1992 was The Sign and the Seal: A Hunt for the Ark of the Covenant.
Then came fingerprints of the gods in 1995 which argued that a vanished advanced civilization seeded the myths and monuments of the ancient world followed by magicians of the gods in 2015.
His books have sold in the millions and in 2022 Netflix aired his series Ancient Apocalypse with a second season in 2024.
His appeal is easy to understand.
He presents himself as an investigative journalist asking uncomfortable questions and he is a gifted storyteller.
He has also made a fair point many times that archaeology has barely explored the continental shelves where much of the ancient coastline now lies underwater.
That point deserves its due.
At the peak of the last ice age about 20,000 years ago, sea levels were roughly 120 m or 400 ft lower than today.
As the ice melted, the oceans rose and swallowed vast coastal plains.
Real researchers study these drowned worlds.
Doggerland, a lost landscape under the North Sea, has been mapped with seismic data.
The Costco cave in France with its ice age paintings now has its entrance 37 meters under the Mediterranean.
Underwater archaeology is a genuine frontier where critics part ways with Hancock is what he concludes from that gap.
He argues that the missing evidence is under the sea.
Archaeologists reply that the submerged shelves have been surveyed for decades by oil companies and academics alike.
And what they have found are river valleys, forests, and hunter gatherer camps, not cities, not machines, not maps.
That disagreement exploded into public view in April 2024.
Hancock sat down with Joe Rogan in episode 2136 of his podcast for a debate of roughly 4 and a half hours with Flint Dibble, an archaeologist at Cardiff University.
Millions watched.
Dibble, who is a lecturer and research fellow rather than a full professor, came armed with slides and sources.
Viewers argued for weeks about who won, and Hancock’s fans and critics each claimed victory.
Hancock saw the encounter and the criticism that followed as proof that the establishment wants to silence him.
Critics saw something different.
A scholar finally engaging with the evidence point by point.
That is where the map comes in.
So let’s meet it.
The admiral and his map.
In 1929, a German theologian named Gustav Adolf Diceman was cataloging the library of the top Kapu Palace in Istanbul when he found a strange fragment of parchment.
It was a map painted on gazelle hyde dated 1513 in the Islamic calendar’s equivalent and signed by an Ottoman sea captain named Piri Race.
Only about a third of the map survives showing the Atlantic Ocean, the coasts of Spain and North Africa, and a long stretch of the Americas.
It is a portalon chart, a type of nautical map crisscrossed with compass lines decorated with compass roses and ships and annotated in Ottoman Turkish.
Piri Race was no mystic.
He was born around 1465 near Gallipoli and he learned the sea from his uncle Kimal race, a famous corsair who became an Ottoman admiral.
He fought in the Mediterranean for decades.
And in 1521, he wrote the Kab Bahrier, the book of the sea, a detailed guide to Mediterranean ports and sailing directions that was updated and recopied for generations.
He presented his world map to Sultan Selim I in Cairo in 1517 after the Ottoman conquest of Egypt.
He was executed in about 1553 after a failed campaign in the Persian Gulf.
Here is the detail that matters most.
Piri Race wrote notes directly on the map explaining his sources.
He says he drew it from about 20 older charts, tomic maps, Arab and Indian maps, Portuguese [music] charts, and one made by Christopher Columbus.
According to his own notes, he got the Columbus material from a Spanish prisoner who had sailed with the explorer on three voyages.
He also mentions maps from the time of Alexander the Great.
Think about what that means.
The mapmaker told us where the western half of his map came from.
And it wasn’t from the ice age.
It came from the discoveries of Columbus and the Portuguese from just 15 or 20 years earlier.
The 1490s and early 1500s were a time when information about the Americas was spreading fast and map makers were scrambling to copy each other.
Hancock reads the reference to Alexander’s time as a hint of far older sources.
That is an interpretation.
The simplest reading is that Piri Race was telling us he used old Greek and Henistic geography for the parts of the world known to the ancients.
Now let’s look at the map itself because the claim is that it is impossibly accurate.
How accurate is it really?
The claim as the source tells it is that the Piri race map shows coastlines and rivers with satellite level precision.
A careful comparison says otherwise.
The coast of Brazil is recognizable and some of the Caribbean islands are in roughly the right places.
But the Atlantic is distorted with South America pushed much closer to Africa than it really is.
Some Caribbean islands are misplaced or mislabeled and the map is peppered with the usual features of the time.
Illustrations of exotic animals and strange peoples and a vignette of the island of St.
Brendan, a legendary island from medieval folklore, complete with a ship and a story about sailors lighting a fire on the back of a sleeping whale.
It also has no latitude and longitude grid at all.
What looks like a net of lines across the map are rum lines.
Compass bearings used by sailors to plot courses between ports.
That matters because of how the argument gets framed.
Hancock and others point out that longitude couldn’t be measured accurately at sea until the 1760s when John Harrison’s marine chronometer was proven in trials.
So, how could a 1513 map be so good?
But a portalon chart doesn’t rely on longitude.
It’s built from compass directions and estimated distances, the data a ship’s pilot actually had.
And the Americas weren’t a mystery to cgraphers in 1513.
The cantino planosphere, a Portuguese map smuggled to Italy in 1502, already shows the Atlantic coast of South America and the islands of the Caribbean.
The Walc Miller world map of 1507, the one that first used the name America, goes even further.
It shows the new world as a separate continent with an ocean to its west.
6 years before Vasco Nunes de Balboa first saw the Pacific from Panama in 1513.
That looks like another impossible map until you remember that Spanish and Portuguese pilots were passing information to map makers and that Europeans had to Asian geography to guess from.
So the Piri race map is impressive, not impossible.
It is a skilled compilation of the best information available in the early 1500s with errors and fantasies mixed in like every map of its day.
Which brings us to the southern edge of the map and the claim about Antarctica.
The Antarctica claim at the bottom of the surviving fragment.
The coast of South America bends sharply eastward and runs along the lower edge of the parchment.
Charles Hapgood, a historian of science at Keen State College in New Hampshire, argued in his 1966 book, Maps of the Ancient Sea Kings, that this land mass was actually the coast of Antarctica, drawn before it was buried under ice.
He had support from an unexpected quarter.
In July 1960, Lieutenant Colonel Harold Olmmyer, commander of the eighth reconnaissance technical squadron of the United States Air Force, wrote a letter replying to Hapgood.
He said the lower part of the map seemed to agree with a seismic profile of the Queen Ma land coast made in 1949 by a Norwegian British Swedish expedition which suggested the coast had been mapped before the ice covered it.
That letter is often described as a military analysis.
It is worth being precise about what it was.
A private reply from an Air Force officer to a professor who had asked for his opinion.
It was not a formal study and Olmire was not a historian of cgraphy.
Now the science Antarctica was not ice-free 12,000 years ago.
The continent has been glaciated for around 34 million years since a major global cooling at the boundary between the Eosene and Oligosine epochs.
The last time it carried forests was tens of millions of years ago.
At the end of the last ice age, the Antarctic ice sheet was actually larger than it is today, not smaller.
Ice cores drilled at sites like Vastto and Dome Sea show a continuous record of snowfall going back more than 800,000 years.
And recent drilling has reached ice more than a million years old.
If the ice had melted away 12,000 years ago, the cores would show it.
They don’t.
Radar tells the same story.
Since the 1960s, aircraft have mapped the bed beneath the ice by bouncing radio waves through it.
The bed map projects Most recently, bedm map 3 in 2022 show the mountains, basins, and lakes beneath the ice sheet.
The coast of Queen Ma land lies under about 2 km of ice in places.
When researchers lay the real subglacial coast beside the Piri race map, the match is poor.
So what is the southern land mass?
The most common explanation is simpler.
Piri race ran out of parchment.
He drew the coast of South America continuing south and then east to fit the page and this was a common practice.
Another is that it reflects Terra Australis, a hypothetical southern continent that European geographers had imagined since antiquity, which leads to the other maps in the story.
The southern continent that wasn’t the source lists several other maps said to show Antarctica with impossible accuracy.
Oransf’s map of 1531, Merkar’s world map of 1569, and Philipe Bashe’s chart of 1737.
Here is what they actually show.
For centuries, European thinkers believed that a great southern landmass must exist to balance the continents of the north.
The idea goes back to Aristotle and Tommy and the name for it was Terra Arales, the southern land.
When Ferdinand Mellin sailed through the straight at the tip of South America in 1520, he saw land to the south, Tiierra del Fuego, and many assumed it was the edge of this great continent.
So mapmakers drew it.
Orans Fine’s map of 1531 shows an enormous southern continent, much larger than Antarctica, stretching toward the equator in places and decorated with imaginary rivers and mountains.
Merkar’s 1569 map does the same.
These are theoretical continents drawn from speculation and they don’t match the true shape of Antarctica.
They were not corrected until James Cook crossed the Antarctic Circle in January 1773 and found nothing but ice and fog.
Basher’s 1737 map is the most famous case because it shows Antarctica split in two by a straight which supporters say matches the real geography of east and west Antarctica separated by a deep basin under the ice.
But Bashe was drawing a theory.
He believed the southern lands were arranged around a polar sea.
And he drew a hypothetical channel that the real continent once you remove the ice in a computer model resembles a pair of land masses is a coincidence that has been noticed after the fact and in the real world with the ice removed the land would rebound upward and the shapes would shift.
This is a known trap sometimes called the Texas sharpshooter fallacy.
If you draw a target around wherever your bullets land, you can always claim a bullseye.
With dozens of speculative maps and an ice-free Antarctica to compare against, you can always find a match.
And what about the Portalon charts?
Hancock argues that they too hold secrets.
The Portalon mystery portalon charts first appear in the historical record in the late 13th century.
The oldest surviving example, the Carta Pisana, dates to around 1275 to 1300 and is now in Paris.
The first dated chart is by the Genoies ctographer Petro Viscante from 1311.
Others like Angelino Dulert’s chart of 1339 are works of beautiful craftsmanship.
Hancock and others argue that these charts appeared suddenly with no earlier stages and that they show coasts and even drowned shorelines with a precision beyond medieval means.
Some claim they preserve an ice age survey.
Historians of cgraphy like the late Tony Campbell of the British Library have given a more ordinary account.
The charts appeared when the magnetic compass came into use among Mediterranean sailors around the 12th century.
The charts are essentially a record of compass bearings and estimated distances between ports passed down and recopied.
Their sudden appearance is partly an accident of survival.
Charts used at sea were worn out and the earliest ones simply didn’t last.
Their accuracy has limits.
The Mediterranean and Black Sea, sailed constantly, are drawn well.
Away from them, the accuracy fades, and the charts distort the Atlantic coasts, the British Isles, and the Baltic.
They show coastlines as they were in the Middle Ages, not at the end of the ice age.
When they depict features that no longer exist, those are typically legendary islands.
The claim that they required trigonometry and spherical geometry also doesn’t fit.
Portalon charts were drawn on flat parchment without any projection and that is one reason they distort at large scales.
They don’t show the curvature of the earth because their makers weren’t modeling it.
Eratosines had measured the earth’s size around 250 BC and Tommy compiled coordinates in the 2n century AD but portalon charts weren’t based on them which raises the Alexandria link the library of Alexandria.
The story’s next move is to connect piri race to the library of Alexandria, the great institution founded under Tommy I in the early 3rd century BC.
Hancock argues that the library held maps from a lost civilization and that fragments of that knowledge filtered through the Islamic world into Europe.
Let’s look at what the library actually did.
It was a real center of scholarship.
Eratosines served as its head and he calculated the earth’s circumference to within a few percent.
Later, Tommy worked in Alexandria and wrote his geography around 150 AD, a catalog of coordinates for thousands of places.
These works did survive.
They were preserved in Byzantium and the Islamic world and a Latin translation of Tammy appeared in Italy in 1406 helping launch a new era of European mapmaking.
So there was a real transmission of ancient geography to Renaissance mapmakers and piri race did site tomic sources but tomy’s maps show the old world with Europe, Africa and Asia distorted and incomplete.
They don’t show the Americas and they certainly don’t show an ice-free Antarctica.
They have a vast Indian Ocean enclosed by land, a mistake later corrected by sailors.
As for the library’s fate, it didn’t vanish in a day.
It suffered damage in Julius Caesar’s fire in 48 BC, declined under Roman rule, and was largely gone by late antiquity.
The idea of ice age charts surviving there is not supported by any text.
No ancient writer mentions such a thing.
So the library supports a real story.
The long journey of Greek geography into medieval Europe, but it doesn’t support a lost civilization.
Next, the question the source asks next.
Why don’t they want us to know the silence of the establishment?
The source says archaeologists are trying to silence Hancock.
The Society for American Archaeology, it says, has warned against his work.
Journals refused to publish him and universities discourage students from engaging with his ideas.
Let’s test that.
The SAA did write to Netflix in late 2022, asking that Ancient Apocalypse be reclassified as science fiction rather than documentary and criticized the series for presenting speculation as fact and in their view for diminishing the achievements of ancient peoples around the world.
Netflix kept it in the documentary category, but silencing is hard to see.
Hancock has sold millions of books, appeared on one of the most popular podcasts in the world, and had two seasons on Netflix.
When Flint Dibble and others debated him, they did so openly with hours of public conversation.
Dibble himself has said the goal was to engage rather than ignore.
As for journals, Hancock has mostly published through books and television rather than peer-reviewed papers.
Critics say that is exactly the problem.
An extraordinary claim needs peer review so that other experts can test it.
Hancock says journals are closed to outsiders.
That is a real argument about how science works, but it differs from suppression.
Here’s another way to see it.
Real discoveries that overturn old ideas do get through.
In 2021, researchers reported fossilized human footprints at White Sands, New Mexico, dated to between 21,000 and 23,000 years ago, much earlier than the long-standing consensus for humans in the Americas.
The dating was challenged and then in 2023, a second team confirmed it using different methods.
Hancock cites this find and it is a good example of mainstream science changing its mind in public on evidence.
It also shows what was there footprints of ordinary people including teenagers and children not maps or consider Gobeclete the site in southeastern Turkey that Hancock often highlights.
Excavated from 1995 by the German archaeologist Klaus Schmidt, it dates to around 9,500 BC about 11 12,000 years ago.
It has carved stone pillars up to 5 1/2 m tall.
Kahanepe nearby is similar.
Archaeologists didn’t hide these sites.
They are among the most celebrated discoveries of the last 30 years and they rewrote the textbooks showing that hunter gatherers could organize monumental construction before farming.
That is a powerful lesson.
The mainstream does revise when the evidence is there and it did so without proposing a lost technological civilization because the sites contain stone tools, animal bones and carvings but no metal, no machinery and no maps.
One more example, the one the source mentions in passing.
In 2024, researchers announced the discovery of a large Maya city.
Valyriana in Campe, Mexico.
It was found not underground, but under the rainforest using lidar, a laser scanning technique that sees through the canopy, and the results were published in a peer-reviewed journal.
That’s how hidden things get found.
Now, to the biggest claim of all, the cataclysm and the civilization.
Hancock proposes that around 12,800 years ago, a cosmic impact triggered a catastrophe that ended an advanced ice age civilization.
He points to a real climate event, the younger Dus, a sudden return to near glacial conditions that lasted about 1,200 years ending around 11,700 years ago.
The younger dryus is well documented in Greenland ice cores and elsewhere.
What caused it is debated.
One hypothesis proposed in 2007 by Richard Firestone and colleagues suggests a comet or asteroid impact, citing microscopic diamonds and other materials in sediment layers.
Other scientists have challenged these findings, arguing that the markers appear at different times, that they have natural explanations, and that no impact crater of the right age has been found.
A major critical review in 2023 concluded that the evidence does not support the impact hypothesis.
Another leading explanation is that a surge of melt water from the great North American ice sheets disrupted the Atlantic circulation.
Flood myths too have explanations.
Many ancient peoples lived near rivers and coasts and remembered real floods.
Postglacial sea level rise was real and in some places it was dramatic.
The Black Sea, for instance, filled with Mediterranean water at some point around 7,600 years ago.
But those events differ in time and place, and they don’t point to a single worldwide catastrophe.
And what is missing is the civilization itself.
An advanced society with technology capable of aerial or orbital mapping would leave traces everywhere.
Metal, glass, ceramics, waste, roads, [music] tools, and the isotopic signatures of industry in the sediments.
The researchers Gavin Schmidt and Adam Frank explored this in a 2018 paper.
They called the Siluran hypothesis, asking how we detect an earlier industrial civilization.
Their conclusion was that it would be hard but not impossible, and that a global society would leave chemical fingerprints.
In the case of the ice age, we have very detailed ice cores, ocean sediments, and cave deposits, and none of them show such a signature.
By contrast, we do have the record of the hunter gatherers.
We have their cave paintings, their tools, their footprints, their burials, and their remarkable monuments.
It is a rich story, and it needs no lost technology to be astonishing.
So, what about the source’s last bold idea?
That the maps were made by satellite.
Satellites in the Ice Age.
The source suggests that the precision of the maps implies aerial or even orbital surveying.
This is where the theory runs into its biggest problem, the maps themselves.
If a civilization had surveyed the world from above, the maps would be uniformly accurate.
They would show a consistent projection, correct proportions, and coordinates.
Instead, the maps we have show the opposite.
They are accurate near the places map makers knew well and increasingly distorted farther away.
They contain errors that are traceable to specific sources.
The pir race maps Caribbean, for example, reflects the confusion over Columbus’s discoveries, and the shapes of its islands match the sketches of the time.
The southern continent reflects theory, not survey.
Errors are a kind of fingerprint.
They show how a map was made.
The mistakes in medieval charts line up with the mistakes of their sources and with the limits of compass and pace navigation.
A satellite survey preserved and copied would not produce them.
And there is something more.
If this knowledge had been passed down over 12,000 years, copied by scribes through hundreds of generations, we’d expect it to degrade in a known way.
But we’d also expect to see the original somewhere in a language, a tradition, a civilization that kept it.
None of the many cultures that maintained records through that time, from Mesopotamia to Egypt to China, shows any sign of it.
The source also says, “Portalan charts demonstrate an understanding of trigonometry and spherical geometry beyond what historians admit, but the real history of mathematics is well documented.
Greek mathematicians had spherical geometry and trigonometry by the 2n century BC.
Islamic scholars refined them and European navigators used tables from the 1400s.
There is no gap that needs a lost civilization.
So where does that leave Hancock’s central argument what it would take?
Let’s be fair to the question because it is a good one.
If a lost advanced civilization existed, what would convince a skeptic?
First, physical remains, tools, structures, or artifacts dated to the ice age that show technologies beyond hunter gatherer capabilities.
Second, a trace in the environment, such as metals, pollutants, or isotopes in ice cores or sediments.
Third, maps.
A real ice age map would need an unbroken chain of copies, a clear match to the real ice age coastline, and an independent date.
Fourth, more underwater exploration of the drowned continental shelves which is happening and which could in principle find anything the theory predicts.
None of these has appeared.
Yet the work continues.
New LAR surveys, underwater mapping, ancient DNA, and improved dating are transforming our picture of the past every year.
If a surprise is waiting, that is where it will show up.
And there is something else worth saying.
The theory has a cost.
By suggesting that ancient peoples couldn’t have built great monuments or sailed the oceans without a lost civilization, it risks underelling them.
The builders of Gobeclete, the Polynesians who crossed the Pacific in canoes.
The Maya who raised cities in the jungle were extraordinary people.
Their achievements don’t need to be credited to someone else.
The real mystery.
So, let’s return to the map.
Here is what is real.
The piri race map is a genuine 1513 chart painted on gazelle skin by an Ottoman admiral.
It is beautiful and it is a snapshot of how fast geographic knowledge moved around the world in the age of exploration.
Its maker named his sources and they included Columbus.
The southern land is best explained by the limits of the parchment and the idea of Terra Australis and Antarctica under a mile or two of ice has been frozen for tens of millions of years.
What is not supported is that the map shows an ice-free Antarctica, that Portalon charts contain ice age surveys, or that a lost civilization mapped the globe from the air.
For none of those could I find evidence that survives the checks we’ve just run.
But the truth is richer than the legend.
It tells of Ottoman sailors, Portuguese spies, Spanish prisoners, and Genoies chart makers passing secrets across a changing world.
It tells of Greek geographers whose ideas crossed centuries and religions.
It tells of a continent that was imagined for 2,000 years before anyone saw it, and a seabed that scientists are still mapping today.
Whether you find Hancock inspiring or infuriating, his questions have done something valuable.
They’ve sent millions of people to look at old maps, ancient sites, and the real discoveries of archaeology.
The key is to follow those questions all the way to the evidence.
So, here is the rule to take away.
When a map looks impossible, ask who drew it, what sources they named, and where it is wrong.
When a theory says experts are hiding the truth, look at what they’ve actually published and what has changed their minds before.
And when an idea promises to rewrite history, ask what the world would look like if it were true and then go and look.
Are these maps proof of a lost civilization or a misunderstood history?
Tell me what you think in the comments.
And if you want more investigations that follow the evidence wherever it leads, like the video, subscribe, and hit the bell.
Because the past doesn’t need to be impossible to be astonishing.